The future is unattended: A US playbook and reality-check
- Thought leadership
- 11 Minute Read
- Last updated 20/11/2025


Key Insights
-
62% of Americans use unattended options at least weekly signalling a widespread and frequent adoption rate. Only 12% use them daily.
-
Exposure and frustration go hand-in-hand. The touchpoints people hit most such as self-checkouts, parking meters and gas stations, are where pain-points are flagged.
-
Nearly half of US respondents have avoided an unattended option only after one bad experience whereas almost one quarter have done so multiple times.
-
Americans expect parking, fuel, and transit to become unattended-by-default in the next 10 years. The same touchpoints that record today’s highest friction.
-
Surprisingly, what actually moves adoption is neither price nor speed. We will break down what matters most to Americans and why.
Don't have time to read more now? Sign up to our newsletter to get the latest insights directly in your inbox.
In a country as large and diverse as the US, adoption of unattended systems has the potential of looking different in dense urban transit hubs, car-centric suburbs, and rural service stations. With this piece we will dive into the insights from our latest study of 2,004 adults across the US, zeroing in on American usage, widespread pain points, expectations and on the opportunities for the merchant payment enablers who are ready to take action now.
The number of cashier-free touchpoints increases every year and the majority of retailers now offer self-checkout options in one form or another, meanwhile contactless and tap-to-pay now account for roughly a third to two-fifths of in-person transactions, as digital wallets move from online into the store and as phone-based payments are becoming the norm. Biometrics is the next logical step, even if mass use in the US will take time.
It’s important to point out that, because of the US unique territory (spanning from dense transit hubs, car-centric suburbs, and vast rural areas), adoption won’t look the same everywhere. Still, the direction is clear: more purchases initiated on phones and, increasingly, confirmed biometrically, with staff stepping in for support. With this in mind, how often are Americans actually using unattended touchpoints today and what do their experiences reveal?
How often do you use self-checkouts or other unattended payment systems?

According to our data, use is extremely common in the US. 62% use them at least once a week, while only 12% use them daily. Conversely, 38% use them less than weekly or never.
Although frequency of usage might be down to shopping habits or preferences (i.e: weekly grocery in bulk vs daily micro-transactions), in a market defined by frequent, everyday purchases, it’s surprising to see that nearly 40% use unattended systems less than weekly.

Where do we see a real divide? Usage frequency clearly skews younger. Weekly or more frequent use is highest among 18–24-year-olds (69%) and 25–34-year-olds (67%), then gradually declines through mid-life to 60% at 55–64, and 49% for those 65 and older. Daily use shows an even sharper drop, from 16% among 18–24s to just 4% for the 65+ group.
Things change, however, when paying outside of the US. Overall only 37% feel confident using unattended systems while abroad, while a notable 29% struggle to some degree, and 34% say it either doesn’t apply, or haven’t encountered these systems while abroad. Men show both higher exposure and higher confidence abroad (confidence is at 42% vs 33%).

When looking at data across the US’ main regions the picture is consistent but definitely not identical. In the Midwest, about 65% use unattended payments at least weekly, with the Northeast and South close behind at 62%. Comparatively, the West is much lighter at 58%, and it also has the biggest hold-outs—roughly 1 in 9 never use these systems. Daily use is fairly consistent across regions, with about one in ten using it every day.
The South has more heavy users, with 7% using it multiple times a day, while the North-east leans toward once-a-day use, also at 7%. It might not seem like much at first, but imagine a 10-lane grocery. In the Midwest, around 6–7 lanes would be self-serve, while in the West, roughly one full lane’s worth of shoppers never use the machines at all. Looking at where frustrations cluster could offer more insight into these regional differences.
Which unattended in-person payment systems do you find frustrating?

Overall, self-checkouts top the ‘most frustrating’ list (16% of all selections), followed by parking meters/ticket machines (13%), vending machines (12%), pay-at-table (11%), and fuel pumps (10%), while regionally, the Northeast shows a transit footprint with public-transport ticket machines (10%) and a high self-checkout frustration (29%). The South is the closest to the national profile across categories.
In the West, where weekly+ use is lowest and “never” use is highest, EV charging (6%) and bike/scooter rentals (7%) stand out, suggesting pain points cluster around regional infrastructure.
In short, while heavy-use regions (Midwest) register more pain in routine settings, the West and Northeast surface infrastructure-specific pain points (micromobility, charging, transit).
Frustrations with EV charging and other transport-related systems such as bike/scooter rentals seem to bother men more than women (around 60%), whereas the opposite happens for toll booths, photo booths, and arcade/token machines (60%).
By age, “younger-urban” signatures pop: vending machines (27% 18–24), bike/scooter rentals (35% 18–24), and EV charging (29% 18–24), unsurprising for students and city dwellers surrounded by micromobility stations and EV infrastructure.
In contrast, self-checkouts have a stronger mid/older imprint (peaking around 45–64), likely reflecting bigger weekly grocery runs, whereas public-transport ticket machines lean older (21% 65+), as younger riders default to mobile tickets.
Interestingly, pay-at-table frustration rises with age (highest in 55–64/65+), where US full-service and tipping culture meets QR menus, on-table scans, and variable tip prompts, these flows can feel inconsistent or higher-friction.
Have you ever avoided using an unattended payment option because of a bad past experience?

Alarmingly, almost half of Americans say they’ve avoided an unattended payment due to a negative experience, a clear adoption barrier. At the same time, 41% say they’ve never avoided them, and 10% rarely use these systems at all. This means that among the users roughly 54% have avoided an unattended payment at least once.
Notably, nearly 3 in 10 avoiders are repeat / frequent avoiders (the 14% who’ve avoided multiple times), signalling persistent trust issues rather than one-off blips.
Avoidance is highest in mid-life with 52–54% for ages 35–54, a key consumer demographic, and about 50% for 18–34.
The avoidance trend eases instead of increasing among older groups (45% at 55–64 42% at 65+), where non-use also rises (17% at 65+) signalling a correlation between frequency of usage = higher chance of negative experiences = avoidance.
The bottom line? Bad experiences can turn active users into avoiders. To stop the bleed, fix the basics by cutting payment failures, speed up the flow, clarify instructions, and make recovery easier, it’s that or risk losing about half of your addressable users.
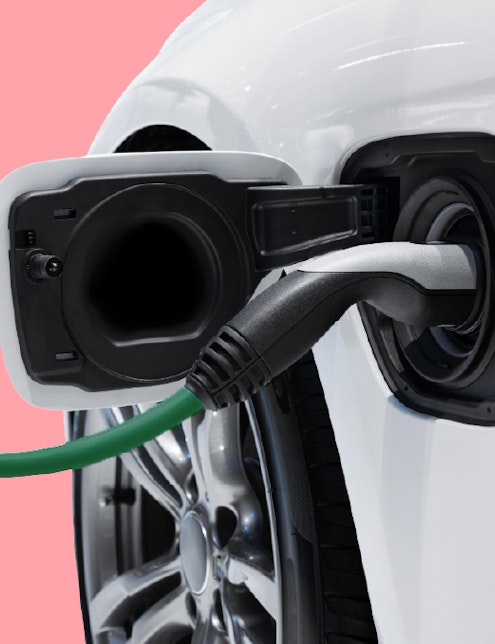
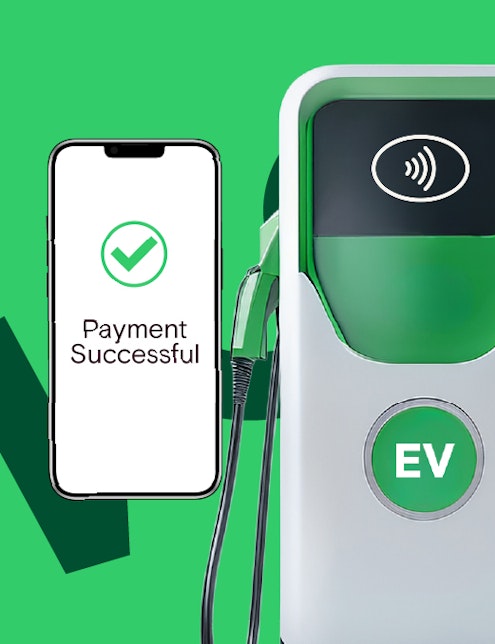
Have you ever used a fuel card for petrol, diesel, or EV charging? And if so, how would you rate your typical payment experience using a fuel card?
In a country often defined by its ‘car-centric culture’ it’s somewhat surprising to see that almost half of the population have never used a fuel card (45%) and a further 12% aren’t sure what one is. However among those who do use them the experience is largely positive with 87% saying it’s very easy or mostly fine and merely 10% calling it frustrating.
Usage skews largely male (51% of men vs 38% of women have used a fuel card), which lines up with where frustrations show up: in the “most frustrating systems” list, fuel pumps sit in the top tier (10% of all mentions), while EV charging is lower overall (3%) but spikes in places like the West and Northeast (at 6%) and also skews male. Ghermaine Henry, our Head of Fuel & Mobility EMEA has commented:
“The data shows that the issue isn’t with the fuel cards themselves, but with the infrastructure and overall awareness. Regional differences are clear, but they can be mitigated through scalable, controlled solutions so that as infrastructure catches up, frustration doesn’t simply shift to the payment experience. When that happens, make sure you’re not the one left behind.”
For rollout teams, simplicity is key: explain what fuel cards are, make sign-up/use dead simple, and a smoother the on-terminal experience, particularly at gas stations (a top frustration) and in EV hotspots, so the good user experience fuel card holders report can scale to the many who haven’t tried them yet.
What improvements would make in-person unattended payment more appealing to you?
So where can we find room for improvement? What aspects do we need to focus on in order to minimize frustration and ultimately, avoidance?

The data shows that the biggest levers for improvement are usability basics, ease, reliability, and clarity, which together account for nearly 40% of all improvement areas. Surprisingly, these outweigh price and speed combined.
Secondary asks are transparency, choice, accessibility, but they trail well behind, and only a small minority say nothing would help or nothing needs improving.
Which one of these things would you not expect to have to use an unattended payment system to access?
Unexpectedly unattended? Not all touchpoints or context should fit for unattended, and if they do, perhaps it’s time to rethink this. Americans may find some scenarios “stranger than fiction” for unattended payment, yet all of them already exist somewhere in the world (yes, even elevator rides).

At the top of the “wouldn’t expect” list are public toilets (15%), elevators and church candles (12%), followed by entering your own building/room (11%).
This is more a matter of expectations rather than feasibility. Paying to use a toilet, to light a church candle, or to ride an elevator to your own floor rubs up against norms of dignity, access, and safety.
It’s safe to say that Americans aren’t saying these things are technically impossible, just that they shouldn’t be paywalled in the first place. If operators do intend to push into these spaces, they need to lead with empathy: make it obvious when and why there’s a charge, keep prices fair, and provide a clear free/attended fallback.
Which of these do you think are likely to become fully or mostly unattended within the next 10 years?
Clearly, Americans are already picturing an unattended future, and all within just 10 years. When it comes to staff, only about six in a hundred think humans will still be needed.
Transport and mobility are where the automation revolution is expected to occur first, possibly because tasks are considered simple and repeatable: parking garages and lots (18%), petrol stations (16%), and public transport (13%), with a second wave in supermarkets (11%), fast food (9%), gyms (8%), and hotels (7%).
Smaller shares foresee the shift happening in convenience stores (5%) and in cafés and pharmacies (4%).

This map of the future echoes today’s pain points:, where the very journeys already heavy with self-serve such as parking, fuel, transit in general are where frustrations cluster and where complete automation is most anticipated.
The payoff is obvious and immediate: fix reliability and clarity there first, terminals that work on the first try (broad card/phone acceptance, offline fallback), standard, multilingual flows, transparent pricing and fees, and visible help with one-tap recovery. In high-frequency contexts, shaving even small failure rates can convert a meaningful slice of the 49% who’ve avoided at least once into steady, confident users.
Americans expect the next decade of “unattended” to land first where the task is simple and repeatable: parking garages/lots (18%), petrol stations (16%), and public transport (13%) together make up nearly half of all mentions.
A second tier follows, supermarkets (11%) and fast food (9%) with gyms (8%) and hotels (7%) close behind. Smaller shares foresee the shift in convenience stores (5%), cafés and pharmacies (4%).
This highlights the payoff comes from fixing reliability and clarity in those journeys first by making terminals work every time (broad card/phone acceptance, offline fallback, fewer declines), standardize on simple, multilingual screens, and show pricing and next steps up front with obvious help paths. As these are high-frequency touchpoints, shaving off even small failure rates turns many of the 49% who’ve avoided once into steady, reliable users.
Do you have any concerns about the increasing use of unattended payment systems?

At first glance, the data might seem to echo the popular idea of ‘machines taking human jobs.’ But on closer inspection, the main concern is much more practical:
Will the machines work when I need them? And will I get help if they don’t?
While job loss concerns rank highest in isolation at 22%, issues like machine faults and lack of help carry more weight overall at 42%. These far outweigh the 7% who say they are not concerned, though privacy (15%) and payment security (14%) still matter.

Looking across age-groups, the mix shifts from job-impact anxiety among younger adults (around 25% at 18–34) toward practical hurdles later in life: concern about not getting help, for instance, rises to 26% among 65+, and consistently, fears of breakdowns remain high throughout (around 21–24%).
What’s one positive thing you associate with unattended payments or self-checkouts?
So what makes unattended so appealing that we can envision it becoming the default in such a short time?

According to Americans, the top upsides are: convenience (28%), speed (23%), and being open 24/7 (22%) these outpace the other by some distance. Still, about one in nine (11%) say there is no positive, so evidently enthusiasm isn’t universal.
Men lean more toward 24/7 access (25% vs 19% for women) and speed (24% vs 22%), while women are more likely to value fewer awkward interactions (11% vs 7%) and at the same time more likely to say nothing positive by a small but notable percentage (12% vs 9%).

The age gradient is by far the most interesting find: the 18–34s range emphasize fewer awkward interactions (19–16%) and convenience (27–31%) whereas 35–44s pivot on speed (27%) then from 45+, appreciation for 24/7 access rises (to around 25%), while “nothing positive” doubles reaching 21% for the 65+.
The core value propositions are universal (easy, fast, always available), but the social interaction element resonates most with younger users. That tracks with a generation raised on screens and accustomed to the online shopping experience where everything is a potential (and instant) touchpoint. Sarah Reineck (formerly Sarah Koch), our Director of Marketing & Communications, has been exploring the ways younger generations are changing the narrative when it comes to in-person payments and setting new standards. As she puts it:
“Gen Z and younger Millennials expect instant, low-stress, phone-first journeys and value control over human interactions. As their spending power grows, this ‘smooth-by-default’ baseline will be the one to set the bar for unattended, by pushing wallets, biometrics, and zero-confusion journeys into the mainstream.”
In conclusion
Americans use unattended systems today and they’ll use them even more tomorrow, but sustained adoption hinges on experience, this is where the age split sets the tone: younger adults prize convenience and control with fewer interactions, while older groups demand resilience. That mix shows up in other outcomes too with almost half having avoided an unattended option after a bad interaction and a sizable minority having done so multiple times.
Transport is the wake-up call. The same journeys people expect to go unattended first and soon are where friction clusters now. The Midwest’s heavy routine use brings routine pain (self-checkout, tolls, fuel). The Northeast flags all kinds of transit touchpoints. The West highlights EV charging and micromobility. If you operate in these verticals, failure isn’t theoretical, it’s tomorrow’s lost customers.
What moves the needle is usability: ease, reliability, and clarity. Go back to basics and make terminals work reliably and smoothly by standardizing simple flows, show pricing and next steps up front, and route help instantly. Do that, and frequent users stay loyal while avoiders come back.
Our CEO, Mike Camerling, put it this way:
“The future of unattended in America won’t be won on technology alone, but on experience, on listening to what younger, online-first consumers actually need. Every smooth tap builds trust; every broken one burns it. When parking, fuel, and transit become boringly reliable, with clear screens, broad acceptance, and one-tap recovery, unattended becomes the norm.”
America isn’t the only player. Our UK report: The state of unattended payments in the UK, shows how consumers in one of the world’s fastest-adopting markets are setting new expectations.
Methodology:
This report draws on a nationally representative survey of 2,004 adults across the United States. The sample was balanced by key demographics, including age and gender, to ensure broad representativeness. State-level figures were weighted in line with actual US population distributions and featured only when relevant. Only states with a sufficiently robust sample size were included in the state-by-state analysis, primarily covering the country’s most populous regions. Macro regions were identified by territorial patterns, cultural heritage and population size.