Key Insights
-
Nearly half of the US population shows a lack of understanding of cryptocurrencies, rising to 70% among those aged 65+.
-
Women are over twice as likely as men to say they don’t understand or use crypto, and are nearly half as likely to actively use it.
-
One wealthy Northeastern state ranks last in both awareness & adoption, while a Midwestern outlier leads the nation with nearly half owning some form of cryptocurrency.
-
A clear majority of people across the states either don’t understand or have never heard of CBDCs.
- Confusion persists over how, and where, digital currencies will actually enter everyday life, especially in the context of in-person transactions.
Don't have time to read more now? Sign up to our newsletter to get the latest insights directly in your inbox.
The United States is often seen as the global leader in technological innovation, and when it comes to crypto and digital currencies, it’s no different. As one of the most influential markets, the US serves as a barometer not only for global adoption, but for the future of digital finance within its own borders.
However, with changes in the world of crypto technology moving at a neck-breaking speed, the question remains: are Americans ready for this revolution, or is the technology advancing faster than public understanding? If the gap between innovation and awareness continues to widen, many could find themselves left in the dust, unable to keep pace with the accelerating changes.
In our latest research, we surveyed 2,004 people across the US and 1,004 in the UK to gauge public awareness and adoption of cryptocurrency. This report focuses on the US, examining how knowledge, perceptions, and usage of crypto differ across demographics and across states.
Our main goal is to assess whether the crypto revolution is moving at a sustainable pace, or if it risks leaving some Americans stranded due to a lack of understanding or accessibility.
Which of the following best describes your experience with cryptocurrencies?
Right off the bat, we see widespread confusion as nearly half of our respondents declare that, although they’ve heard of cryptocurrencies, they don’t fully understand them.
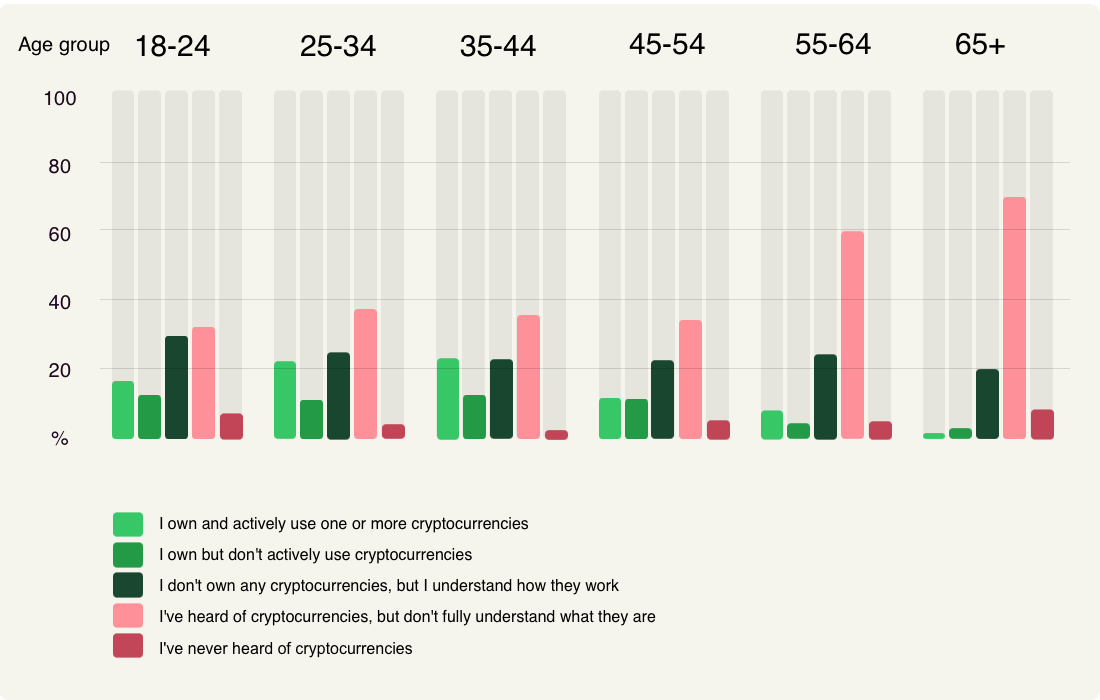
Perhaps unsurprisingly, age plays a role in both awareness and adoption. While confusion around cryptocurrencies remains high across all age groups, it rises from 51% among Millenials to 60% for Gen X, and then to 70% for Boomers. On the other hand, both ‘older’ Gen Zs and Millennials are more likely to own and use crypto, with 21% and 22% respectively doing so.
Crypto experience by age group:
While confusion around crypto is widespread, the gap becomes much more pronounced when you break it down by gender, in both awareness and ownership.
Crypto experience by gender:
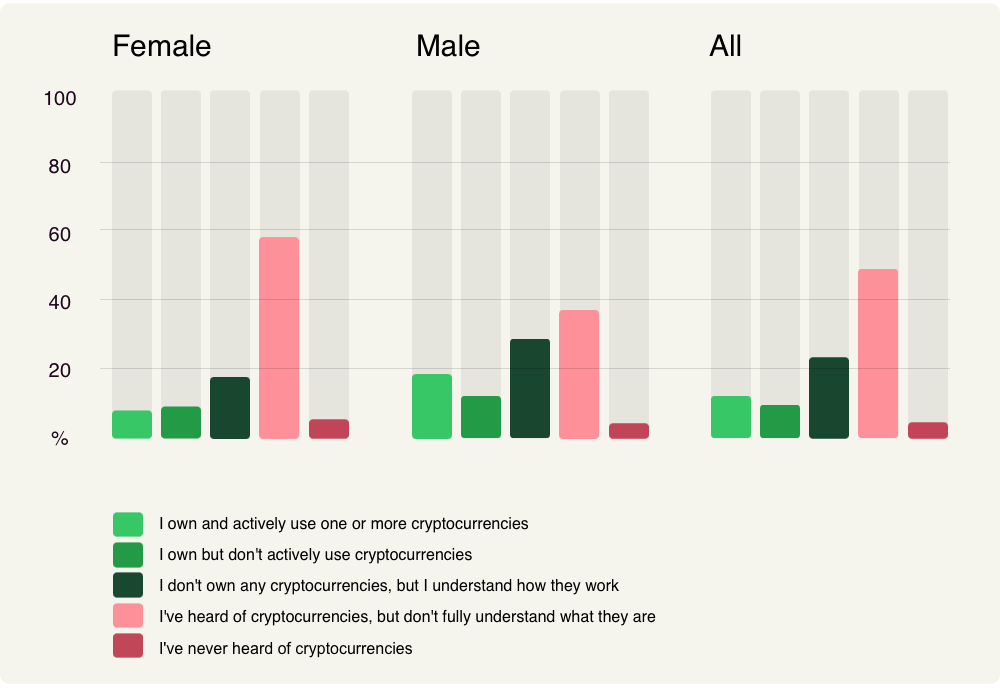
“Nearly 60% of women declare a lack of awareness, compared to just 37% of men. Even more striking, only 8% of women own and use crypto, while almost 20% of men do.”
The disconnect becomes especially apparent when comparing awareness and adoption across states.
Let’s examine Nebraska and New Hampshire. Somewhat surprisingly, Nebraska tops the nation with a 44% crypto ownership rate (four times the national average) despite not being known as either a tech or financial hub.
Top 10 states by ownership rate:
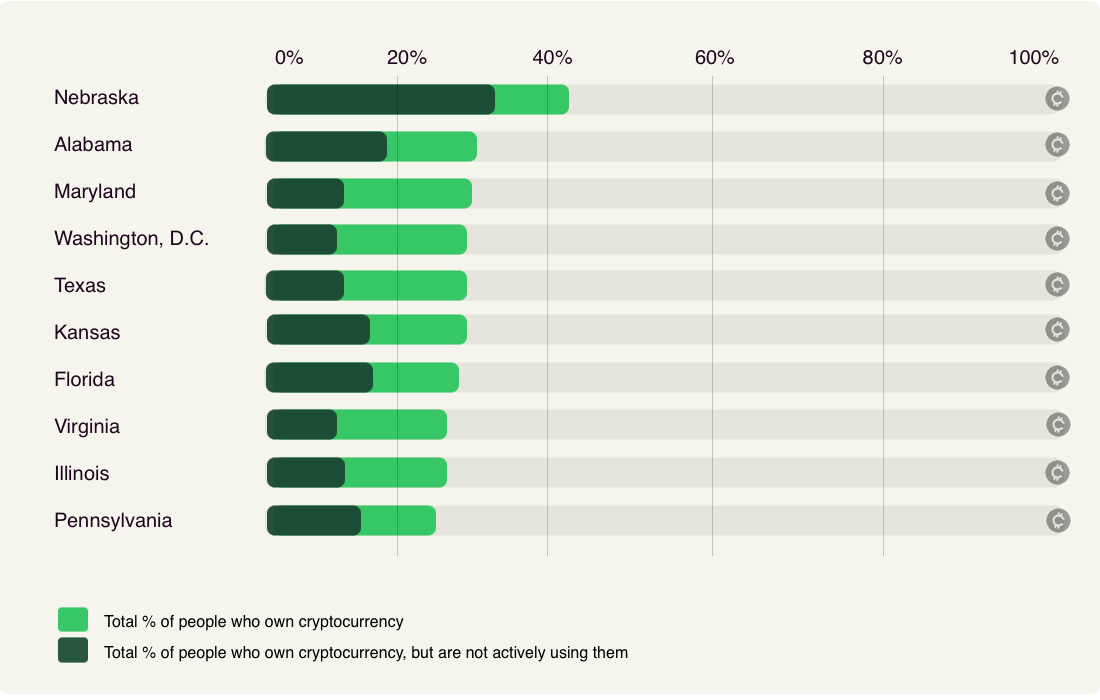
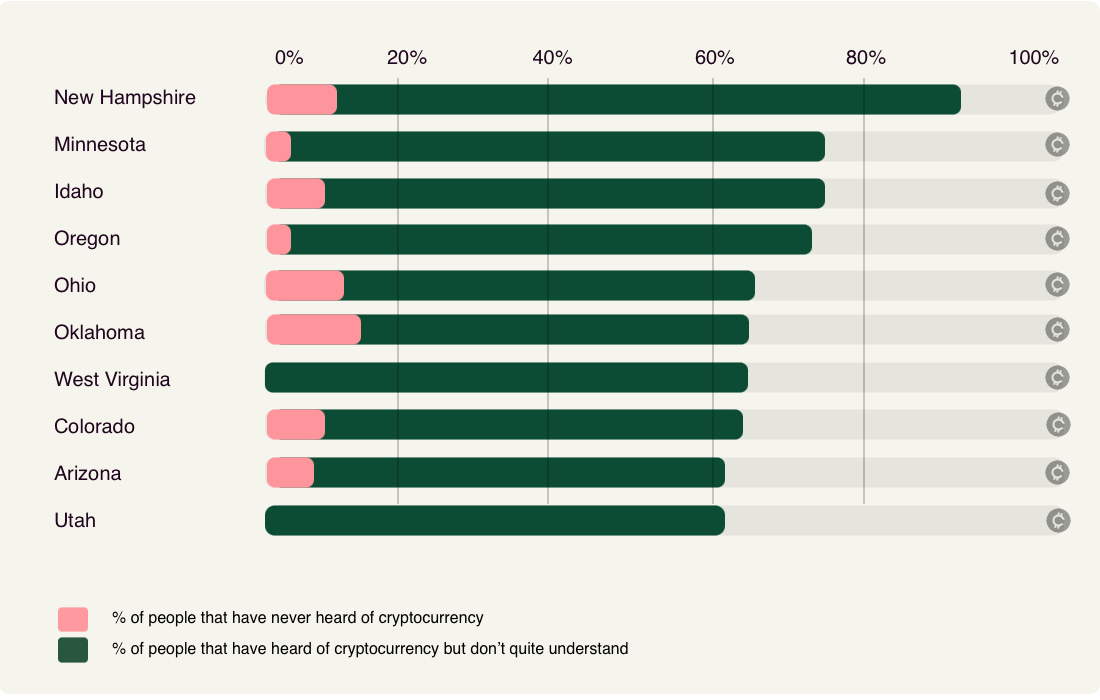
Meanwhile, New Hampshire, a state with some of the highest levels of formal education and one of the top wealthiest in the US, ranks the lowest in ownership, with just 11% adoption, and highest in the lack of understanding of crypto (89%).
This suggests that culture, perception, and attitude, rather than just access or affluence, may be the true drivers behind digital currency engagement.
Lowest awareness states:
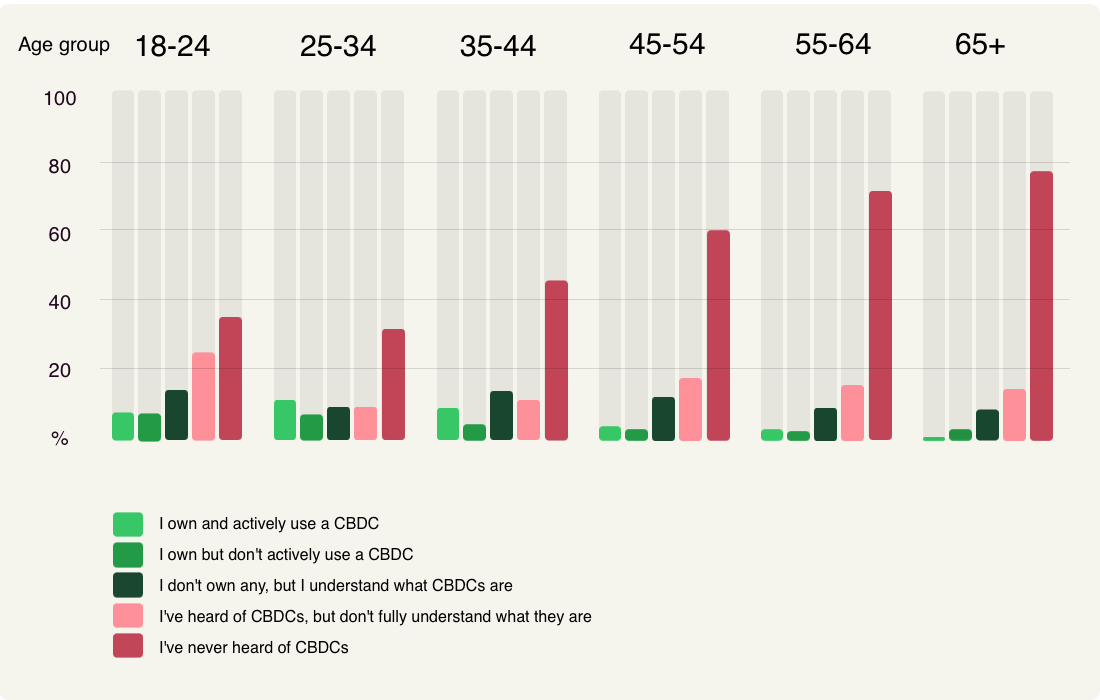
Which of the following best describes your experience with Central Bank Digital Currencies or CBDCs?
Meanwhile, a clear majority of respondents in the US have never even heard of Central Bank Digital Currencies (CBDCs) (61%). This lack of awareness is even more pronounced among women, with 67% unfamiliar compared to 54% of men.
CBDC experience by gender:
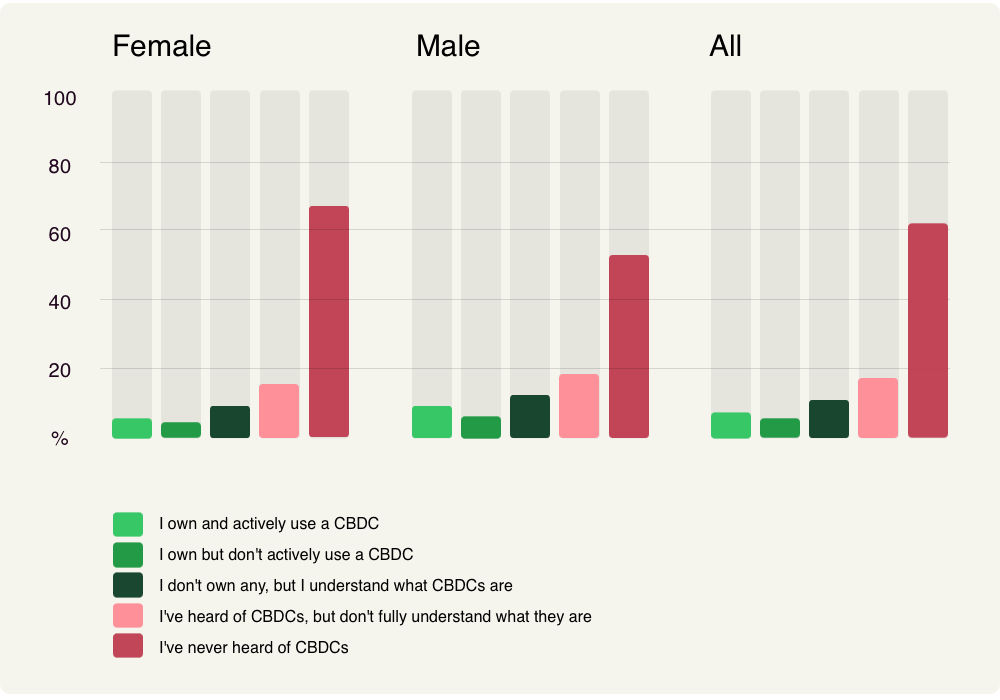
Unfamiliarity remains high across all age groups, especially among Boomers, where it rises to 73%.
CBDC experience by age group:
This pattern of unfamiliarity is not just generational or gendered, it plays out notably at the state level. In a surprising twist, some of the country’s most connected and tech-savvy regions show some of the lowest CBDC awareness. In Washington state, Connecticut, and even Washington, D.C., between 69% and 76% of respondents say they’ve never heard of CBDCs well above the 61% national average.
“These are states deeply embedded in finance, technology, and federal policy, yet they seem to be trailing behind expectedly low-awareness states like Oklahoma and West Virginia.”
Nebraska once again emerges as a national outlier, but on the other end of the spectrum. Only 36% of respondents there have never heard of CBDCs, and 33% say they understand them, which is triple the national average.
Meanwhile, Oregon consistently shows one of the widest digital knowledge gaps, with 80% unaware of CBDCs, and crypto awareness levels lagging 33 points below the national average. As previously outlined, these figures suggest that state-level culture and communication, not infrastructure or economic status, may be the biggest factor shaping digital currency awareness.
Have you ever used digital currencies for a purchase?
While 62% of respondents either already use crypto for purchases or are open to it, a notable 38% are not interested. Once again, women show more hesitation than men, with 42% versus 32% expressing reluctance.
Digital currencies experience by gender:
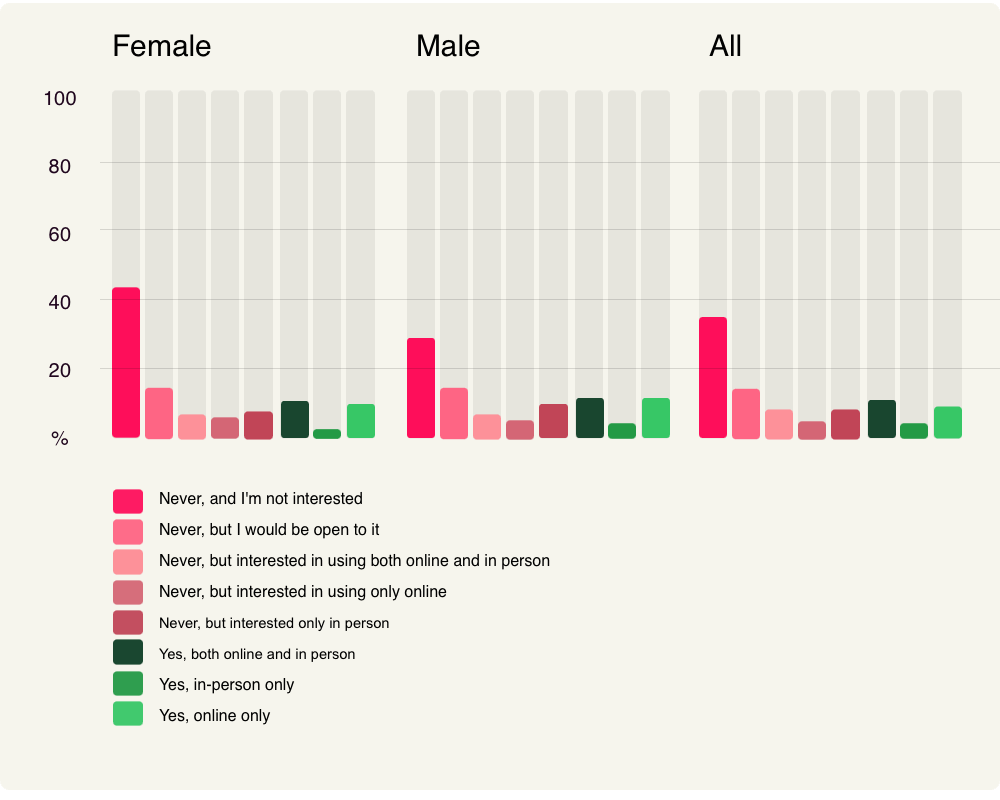
Meanwhile, most respondents who have used crypto in the past have done so exclusively online (14%).
Once again, the lack of interest in adopting digital currencies follows somewhat expected patterns when observing the age-ranges, with Boomers being almost three times as likely to dismiss entirely than Gen Z and Millennials.
Digital currencies experience by age group:
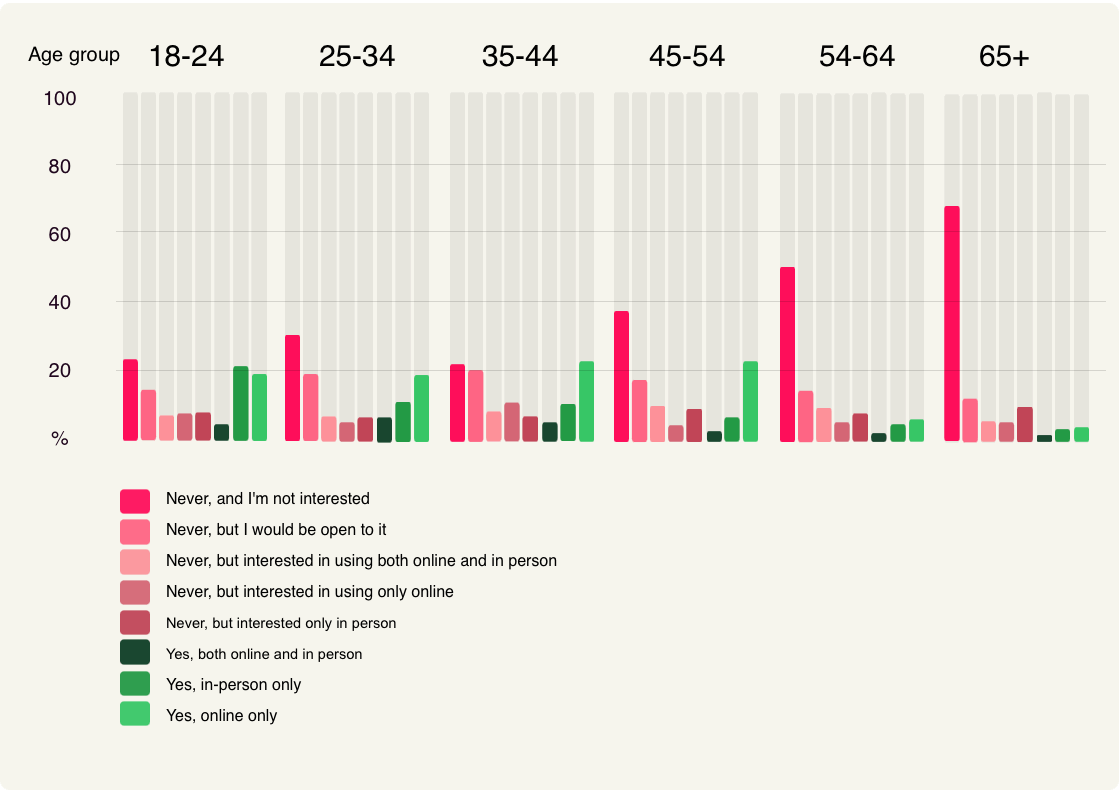
Some of the states with the highest disinterest in using digital currencies defy conventional expectations, however this trend is clearly consistent with earlier findings: in New Hampshire, Oregon, and Washington, 56% of respondents say they’ve never used digital currencies and aren’t interested in doing so, this corresponds to a full 17 percentage points above the national average of 39%.
“For many Americans, the barrier might not be solely on access or education, but also on relevance. Owning crypto is one thing; seeing a reason to use it is another.”
Even states like Minnesota (50%), Idaho (50%), and Wisconsin (51%), often associated with strong digital infrastructure and/or high civic engagement, show elevated levels of disinterest. This confirms that skepticism toward using crypto for everyday purchases is not confined to rural or conservative regions.
On the other hand, states like Maine and Iowa, despite having 0% reported in-person usage, rank highest for openness to trying it, hinting at latent demand once policy and infrastructure improves. Meanwhile, Mississippi stands out with 15% already using crypto in-person, triple the national average of 5%.
Finally, Nebraska, while leading the nation in crypto ownership (44%), also has one of the highest rates of people saying they don’t intend to use it for purchases.
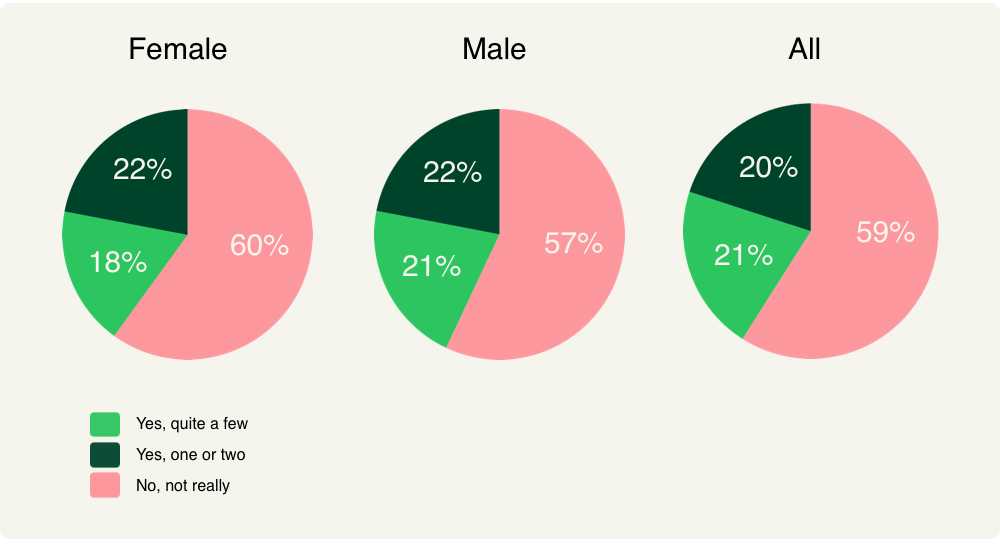
Have you noticed more businesses accepting digital currencies?
Nearly 60% of respondents haven’t noticed any increase in businesses accepting digital currencies. Men are slightly more likely than women to notice businesses accepting crypto: 22% of men report seeing “quite a few” versus 18% of women. This may suggest a modest gender gap in either exposure or interest, echoing broader patterns seen throughout the survey.
Awareness of digital currency acceptance by gender:
Age differences are clear 64% of 18-24 year olds reported some crypto adoption, while only 14% of those 65+ said the same. This sharp,steady decline across age groups highlights a clear trend: the older the respondent, the less likely they are to see crypto in everyday business life.
States where respondents are most likely to report seeing businesses accept crypto, such as Washington, D.C. (60%), Utah (54%), and Virginia (51%), aren’t just noticing signs on storefronts, they’re often the same states that stand out in earlier questions for above-average ownership and active usage. For example, Utah not only ranks near the top for real-world crypto use but also leads in CBDC ownership despite low awareness, signaling an environment of experimental engagement, if not deep understanding.
Top 10 states where business crypto adoption was noticed:
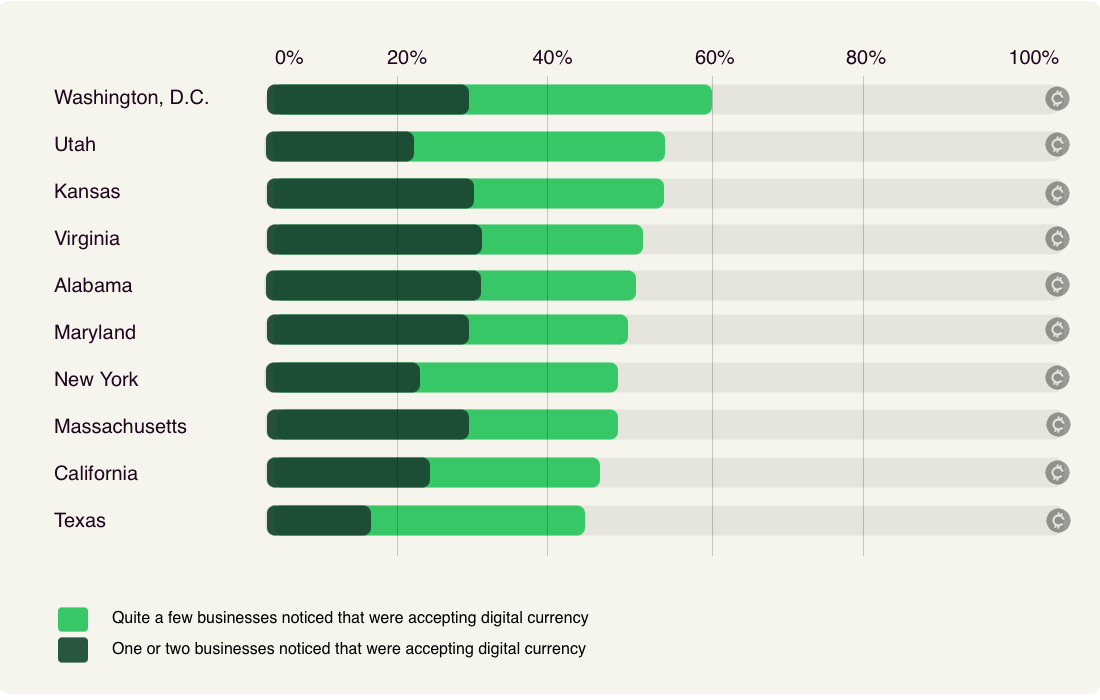
“We can see an emerging pattern: ownership doesn’t always translate into usage. Many states may be ahead in holding crypto, but lag in its everyday utility, either due to low merchant availability or a cultural reluctance to spend it.”
At the other end, states like Oregon (16%), Minnesota (18%), and New Hampshire (22%) show the lowest levels of reported business adoption. This aligns with their broader digital disengagement patterns: Oregon and New Hampshire were previously identified as among the least interested in using crypto for purchases, and New Hampshire and Minnesota also ranked at the bottom for both crypto and CBDC awareness. Perhaps, these states aren’t simply seeing fewer crypto-ready businesses, they may not be looking for them in the first place.
One notable exception is Nebraska, where only 33% noticed business adoption, yet as we’ve seen, it leads the nation in crypto ownership (44%) and CBDC awareness (33%).
Bottom 10 states where crypto adoption was least noticed:

In which types of places or sectors would you expect in-person digital currency payments to become available before others?
When asked where they’d expect to see digital currencies used first, online-only businesses (15%) and large retail stores (11%) topped the list across all demographics. Aside from that, responses were widely scattered and no single sector emerged as a clear frontrunner.
Surprisingly, major fast-food chains, typically perceived as pioneers in in-person payment tech, ranked last (4%), even behind independent shops and cafes.
Distribution of categories by value:
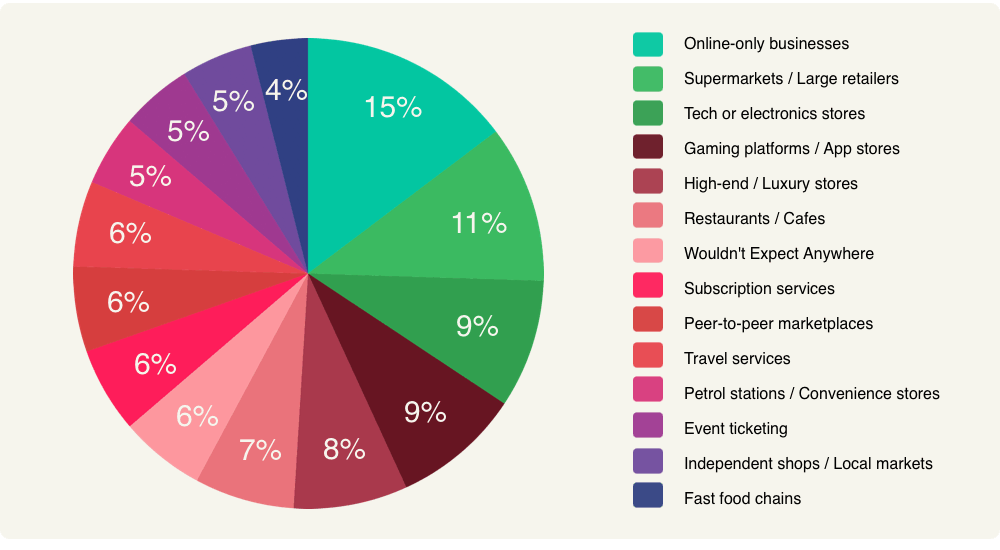
“This suggests that while curiosity exists, public expectations around real-world crypto integration remain fragmented and, at times, counterintuitive.”
Conclusions:
While most Americans are aware of cryptocurrencies, a persistent knowledge gap remains, especially for newer technologies like CBDCs, which an undisputed majority of respondents have never heard of.
Age and, more surprisingly, gender were predictors of awareness and adoption, with older adults and women trailing significantly behind their younger and male counterparts across nearly every metric. Just 8% of women report actively using crypto, compared to nearly one in five men. A notable gender divide.
At the state level, patterns are even less predictable. Some of the most affluent, highly educated, and digitally mature markets show unexpectedly low awareness and adoption, while others, like Nebraska, far exceed national averages, suggesting that culture and perception, more than infrastructure or policy, appear to be behind such a chasm.
Meanwhile, real-life usage is still largely limited to online purchases, and most Americans have not noticed businesses adopting crypto more widely and, even when asked where they expect to see crypto in-person first, public opinion was very fragmented with counter-intuitive choices.
What emerges is a highly complex picture of uneven awareness, cautious interest, and most importantly, a significant gap between ownership and actual utility, calling for a growing need for clearer communication, a more user-focused approach to digital finance adoption, and especially a more inclusive narrative.
Think you’ve got digital currencies figured out? Find out with this quick quiz.
Methodology:
This report draws on a nationally representative survey of 2,004 adults across the United States. The sample was balanced by key demographics, including age and gender, to ensure broad representativeness.
State-level figures were weighted in line with actual US population distributions. Only states with a sufficiently robust sample size were included in the state-by-state analysis, primarily covering the country’s most populous regions.
Interested in reading more around this subject? Here are some useful articles…
